The subset of Artificial Intelligence, Machine Learning (ML), is a field that the internet has democratized since then. A programmer interested in developing models and willing to learn can try state-of-the-art algorithms using Machine Learning and learns in minutes.
These can guide and help programmers develop practical models to help in their daily life or at work. Random forest is one such example of Machine Learning. It is a supervised ML algorithm, the most flexible, easy-to-use, and popular algorithm for classification and regression, and developed for ensembling the Decision Trees.
This article is a walkthrough of an end-to-end implementation of the ML random forest models for effective decision-making. But before jumping into the main topic, users must be ready with their laptop, Jupiter Notebook for visualization, or users can use PyCharm for running CSV files. So, let us start with some simple decision-making pictorial examples.
Random forest Examples
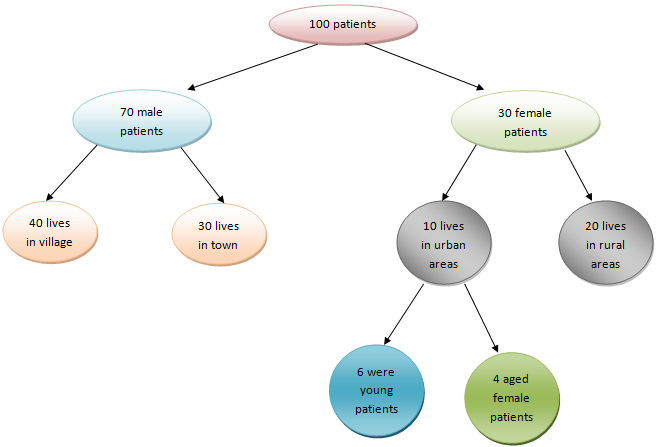
In the above pictorial image, we have four layers with nine oval-shaped objects having text. Collect the native information by reading the texts and see how we connected each layer with the previous ones. The layers define the depth of the decision tree.
We consider the first layer as layer "0," the second as layer "1," and the third as layer "2." From this record, suppose we want to find some more information:
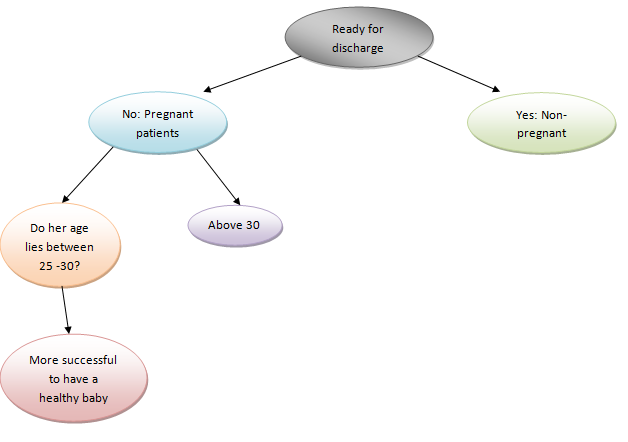
The above pictorial image depicts that we can get the answers to each question by serially noting the information in each node. The right-hand side layers of nodes indicate that the tree can undoubtedly lead to a decision. In our case, the patient can successfully give birth to a healthy baby, i.e., “More successful to have a healthy baby.”
The random forest algorithm designs a set of decision trees from a few haphazardly chosen subsets of the training set and selects predictions from each tree. Then through voting, the random forest algorithm determines the best and most effective solution.
Workings of the Random forest Algorithm
The following steps will make you understand how Random forest Algorithm works:
Step 1: The algorithm selects random data models from the provided dataset.
Step 2: Then, it creates a decision tree for each model and assumes all predicted outputs of the decision trees.
Step 3: It selects the most voted outcome of those decision trees using the voting mechanism.
Build and Train Random forest Models with Scikit-Learn
The Python Scikit-Learn tool is an efficient library for data analysis with various features like classification, regression, and clustering algorithms, including support-vector machines, etc. It helps predict and study large datasets in an organized manner to extract a meaningful conclusion and gain insight.
Here, we will create a dataset in an Excel sheet and use some data regarding patients with low, medium, and high chances of successful births to healthy babies.
Let us build a random Machine Learning Model with the Python Scikit-Learn:
Step 1: Create a CSV file with a .csv file extension or download our sample file
Step 2: Add data into the file with their respective header names.
Step 3: We first import the libraries in the Python program to read the CSV file:
import matplotlib.pyplot as plt
import numpy as np
import pandas as pd
import seaborn as sns
Code Snippet:
import numpy as np
import seaborn as sns
import matplotlib.pyplot as plt
import pandas as pd
a= pd.read_csv("random_forest.csv")
print(a)
Output:
Explanation:
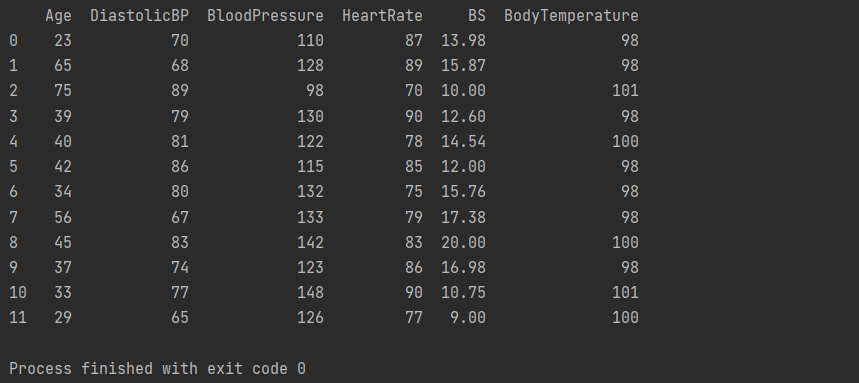
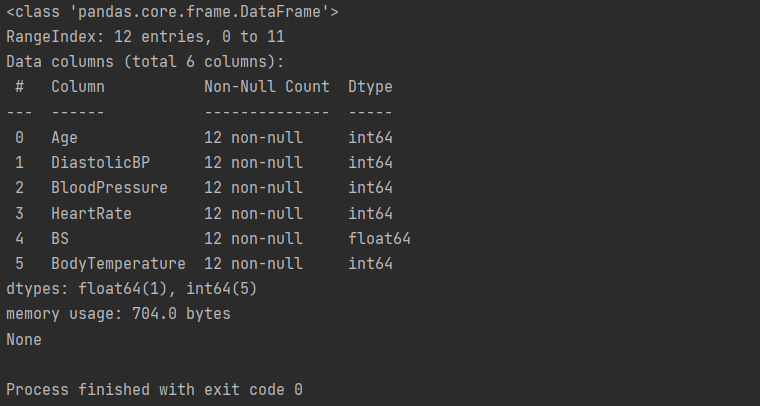
This library will load all the data the "random_forest.csv" file has. As you can see in the output console, there are twelve rows with six columns:
- Age: Patient's age (in years).
- DiastolicBP: This attribute indicates the lower value of Blood Pressure (in mmHg)
- BloodPressure: This attribute indicates the upper value of Blood Pressure (in mmHg)
- BS: Short for blood glucose; indicates blood levels concerning a molar concentration (mmol/L).
- HeartRate: The attribute lists the data of the heart rate test in beats per minute.
- BodyTemperature: Indicates the body temperature
Code Snippet:
a= pd.read_csv("random_forest.csv")
print(a)
print(a.head())
Output:
Explanation:
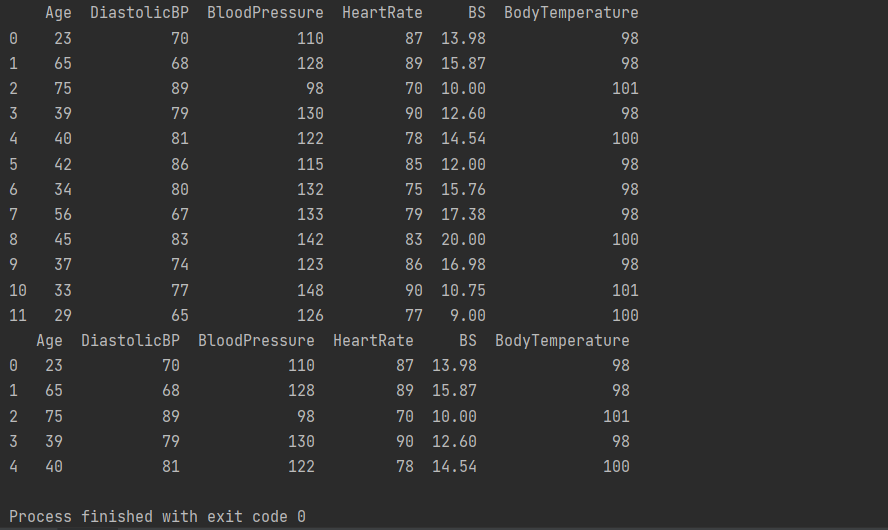
The head() command will highlight only the first five lines of the datasets in the console.
Code Snippet:
a= pd.read_csv("random_forest.csv")
print(a)
print(a.info())
Output:
Code Snippet:
a= pd.read_csv("random_forest.csv")
print(a)
print(a.describe().T)
Output:

Code Snippet:
a= pd.read_csv("random_forest.csv")
print(a)
print(a.describe().T)
Output:
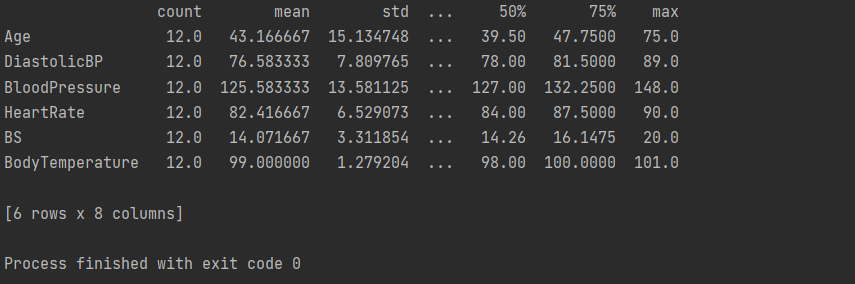
Explanation:
In the above output console, note that the mean values are far from the standard deviation (std). It implies that the data does not necessarily follow a well-behaved statistical distribution. It would have guided the model while predicting the risk if it followed.
Thus, we have to preprocess the data to make it more figurative. It will portray the datasets as if these were data from the whole world population or more normalized.
One of the great benefits of using the Random forest models for classification is that the inherent tree structure can work well with data we have not normalized once it splits the data by the value into all the tree levels for each variable.
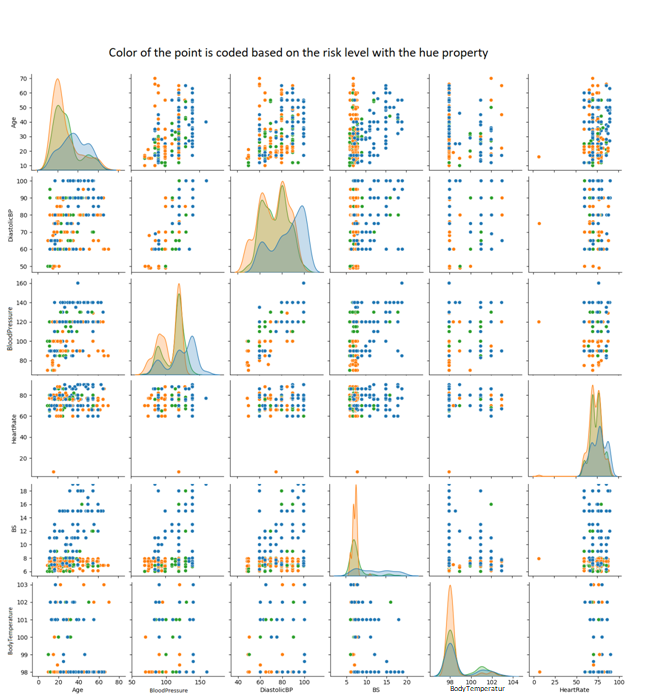
Visualizing the Data
Now, users can also quickly visualize the data by analyzing the combinations of points for each pair of features using the Scatterplot. They can also study how the points are scattered by visualizing the histogram curve.
Thus, users should use the Seaborn's pairplot(), which integrates both plots. It creates both plots for each feature combination and displays the color of the point coded based on the risk level with the hue property:
res = sns.pairplot(a, hue= 'Risk_Level')
res.fig.suptitle("Color of the point is coded based on the risk level with the hue property",
fontsize = 10, # defining the size of the title
y= 1.00);
This generates the given plots in Jupiter Notebook:
Code Snippet:
import matplotlib.pyplot as plt
import seaborn as sns
matplotlib inline
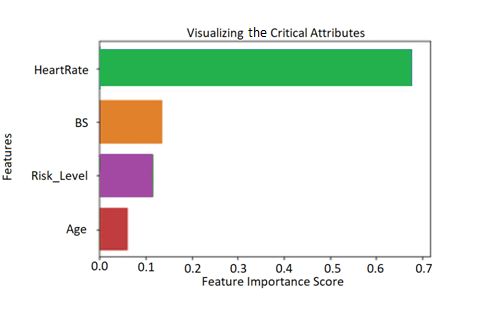
sns.barplot (x=f_important, y=f_important.index)
plt.xlabel('Feature Importance Score')
plt.ylabel('Features')
plt.title('Visualize the Critical Attributes')
plt.show()
Data Preprocessing for Classification
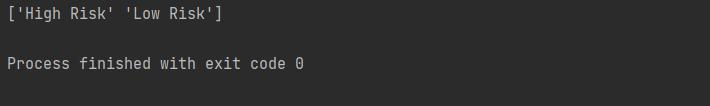
Using the unique() command, users can display the unique values of the given column name (here, Risk_Level). It will ensure the attribute Risk_Level has two classes.
Step 1: Code Snippet:
import numpy as np
import seaborn as sns
import matplotlib.pyplot as plt
import pandas as pd
a= pd.read_csv("random_forest.csv")
print(a['Risk_Level'].unique())
Output:
Step 2: import pandas as pd
a= pd.read_csv("random_forest.csv")
print(a['Risk_Level'].unique())
print(a['Risk_Level'].replace('Low Risk', 0).replace('High Risk', 1))
Output:
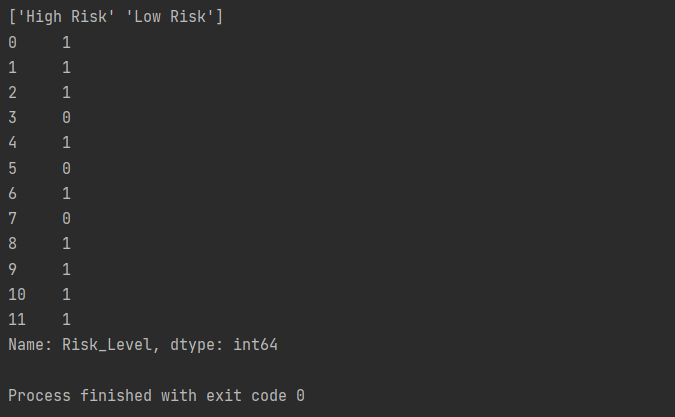
Explanation:
We replaced and transformed each value of the attribute Risk_Level into numbers. We used o and 1 to signify Low Risk and High Risk. We used the .replace() method to replace them with their integer representations.
Step 3: It will divide the data into two divisions for training the data models.
p = a['Risk_Level']
q = a.drop(['Risk_Level'], axis=1)
Step 4: Users can use Scikit-Learn’s train_test_split method to divide the dataset into train and test.
Code Snippet:
from sklearn.model_selection import train_test_split
demo = 42
x_train, x_test, y_train, y_test = train_test_split(x, y, test_size=0.2, random_state=demo)
Step 5: Now, users need to implement Scikit-Learn ensembles under sklearn.ensemble module. This technique in classification will take the majority of the votes from the data, and users implement it as RandomForestClassifier.
Thus, importing the random forest classifier function from the sklearn ensemble module will do the rest. Create a random forest classifier model using the random forest classifier function.
from sklearn.ensemble import RandomForestClassifier
random_forest_c = RandomForestClassifier(n_estimators=2, max_depth=2, random_state=demo)
random_forest_c.fit(x_train, y_train)
y_pred = random_forest_c.predict(x_test)
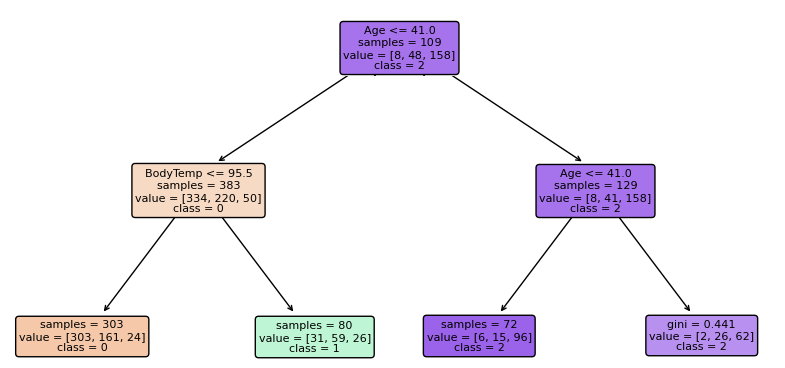
Step 6: Predicting and evaluating the values with the random forest classifier model
from sklearn import tree
f = p.columns.values
c = ['0', '1']
for estimator in random_forest_c.estimators_:
    print(estimator)
    plt.figure(figsize=(15, 8))
    tree. sample_tree(estimator, feature_names=f, class_names=c, fontsize=10, filled=True, rounded=True)
    plt.show()
Random forest for Regression
Users can also use Random forest to solve regression problems and predict data based on their requirements. They will do it using Scikit-Learn.
Data Preprocessing for Regression
Step 1: Code Snippet:
import numpy as np
import seaborn as sns
import matplotlib.pyplot as plt
import pandas as pd
a= pd.read_csv("random_forest.csv")
Step 2: Users can use Scikit-Learn’s train_test_split method to divide the dataset into train and test.
from sklearn.model_selection import train_test_split
demo = 42
y = dataset['BloodPressure']
x = dataset.drop(['BloodPressure'], axis=1)
x_train, x_test, y_train, y_test = train_test_split(x, y, test_size=0.2, random_state=demo)
random_state=demo)
We are working with a regression model. Here, users can predict one of the numerical columns of the dataset instead of predicting classes. In the above code, we have predicted the BloodPressure column.
It signifies the y data will contain blood pressure rate, and the x data will include all of the features besides blood pressure. Then, we will split the data into two divisions, train and test sets.
Step 3: Now, we will import the random forest classifier function from the sklearn ensemble module and implement RandomForestClassifier.
from sklearn.ensemble import RandomForestRegressor

random_forest_c = RandomForestRegressor(n_estimators=10, max_depth=3, random_state=demo)
random_forest_c .fit(x_train, y_train)
y_pred = rfr.predict(x_test)
Step 4: Predicting and evaluating the values with the random forest classifier model
from sklearn import tree
f = X.columns
the_first = rfr.estimators_[0]
plt.figure(figsize=(15,6))
tree.sample_tree(the_first, feature_names=f, fontsize=10, filled=True, rounded=True);
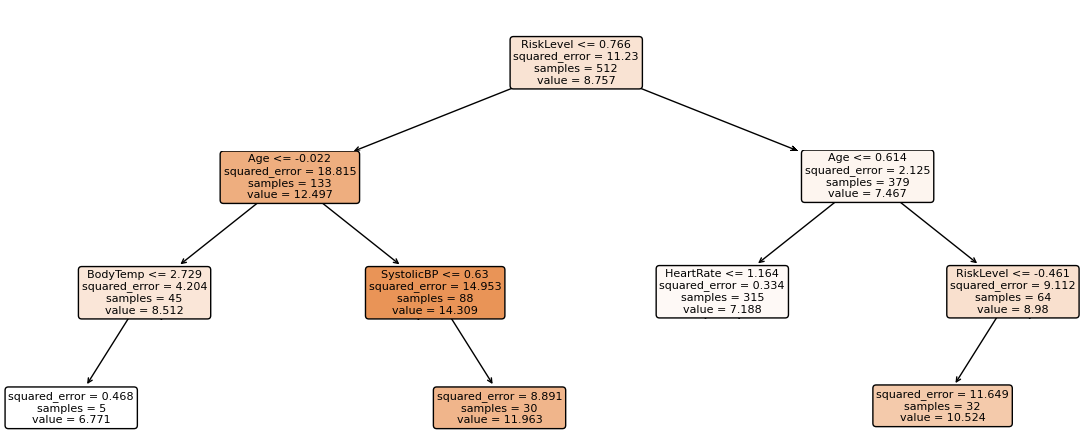
Note: We have ten trees and designed the plot with regression.
Benefits of Using Random forest
The following are some advantages of using Random forest:
- Many data analysts and experts recommend using this algorithm as it is highly accurate. It gets the results by building multiple decision trees.
- The Random forest algorithm is unbiased. It provides depends on majority votes or "the crowd." It reduces the overall degree of bias of the algorithm.
- Overfitting is not a problem while working with a random forest algorithm. The algorithm assumes all multiple decision tree outputs, which creates no bias values in the outcomes.
- Users can use this algorithm for random forest classification and random forest regression models.
- The random forest algorithm allows users to create a desired model in the critical feature selection technique.
Drawbacks of Using Random forest
The speed of generating predictions is the significant disadvantage of the random forest algorithm, which lies in its complexity. This algorithm needs more computational resources. It includes multiple decision trees merged when training large ensembles.
But with the emerging modern hardware, training even a large random forest does not take much time.
Conclusion
This Random forest article covered different scenarios and predictions done with this algorithm using Python and Scikit-Learn library. Further, we explored the implementations of ensembles through sklearn.ensemble module.
To start with this Python algorithm, you only need to install the Jupiter Notebook and keep PyCharm as your side compiler to run the code and see the datasets and visual representations.
Additionally, the article briefly illustrates the benefits and drawbacks of using Random forest algorithm, which might help users to have an in-depth insight in this Machine Learning vertical.